Reading a CSRS-PPP report
The .sum and .pos files from a two-hour static occupation, block by block.
Submit a RINEX file to NRCan's CSRS-PPP service and you get back a zip archive: a
PDF report, a .sum file, a
.pos file, and per-epoch clock and
troposphere files. The PDF is what most people open. The
.sum is the one worth reading — it holds the
whole run on one screen, including the orbit and clock products the answer rests on.
Every block below is copied byte for byte from a real result set: a two-hour static occupation on the Washington University campus with an Emlid Reach RS2, processed by CSRS-PPP 3.54.2 in 2024. Later service versions can format or compute things differently. The input file is the one annotated in Reading a RINEX observation file.
The run
What was submitted, over what span, and how much of it was used.
VER 3.54.2 (2022-11-10)
NOW 2024-09-13 15:23:28.00
RNX rudolph_static_02hr.23O
MKR UNKNOWN
MOD STATIC
BEG 2023-09-13 17:08:00.00
END 2023-09-13 19:07:30.00
INT 30.00
EPO 240 240 35933
EXE 4 sec
OBS G C1C C2X L1C L2X
OBS R C1C C2C L1C L2C
- VER
- Software version. Version 3 resolves carrier-phase ambiguities to integers and version 2 did not, so two reports on the same data are not interchangeable.
- NOW
- When the data set was processed, in UTC, a year after this occupation.
- MKR
- Marker name, as read from the RINEX header.
UNKNOWNmeans that field was left empty, so nothing in the report says which point was occupied. - MOD
STATICsolves one position for the whole session; kinematic solves one per epoch.- BEG END INT
- First and last observation used, and the processing interval in seconds. NRCan solved one epoch every 30 s.
- EPO
- Three counts: epochs processed, epochs attempted, and epochs present in the RINEX file over that span. 240 of 240 succeeded. The third number is far larger because the receiver logged at 5 Hz over its own, longer span: the RINEX file runs from 17:07:51.2 to 19:07:37.6, and (35933 − 1) × 0.2 s is exactly that span.
- OBS
- The observables used, one line per constellation — GPS and GLONASS here, two frequencies each. Whatever else the receiver recorded did not enter this solution.
Products and models applied
SP3 EMR0DCBFIN_20232560000_01D_15M_ORB.SP3
CLK EMR0DCBFIN_20232560000_01D_30S_CLK.CLK
ERP EMR0DCBFIN_20232530000_07D_01D_ERP.ERP
BIA EMR0DCBFIN_20232560000_01D_01D_OSB.BIA
ADV EMR0DCBFIN_20232560000_01D_01D_ADV.ADV
ATX igs20_2303_nrcan.atx
...  VMF (3 lines), SNX (1 line)
ELV 7.5
TZD VMF1
REC EMLID REACH RS2
ANT EML_REACH_RS2   NONE
ARP    0.000    0.000    0.000
PCO G01  -0.001  0.002  0.135
PCO G02  -0.000 -0.000  0.137
...  PCO (2 lines), OTL (2 lines)
IAR 91.76%
AVF 1.000
APR RINEX
ELL GRS80
- SP3 CLK ERP BIA
- The precise satellite orbits, clocks, Earth rotation parameters and bias corrections the solution rests on, named file by file. The PDF report calls this set NRCan/IGS Final. These filenames are what make a PPP solution reproducible.
- ELV TZD
- Elevation mask in degrees, and the a priori troposphere model. Observations below 7.5° above the horizon were not used.
- REC ANT ARP
- Receiver, antenna and antenna reference point, all read from the RINEX header. CSRS-PPP has no other way to know how high the antenna sat, so the reported height refers to wherever the header says the reference point was. Check this triple against your field notes before you use the height. The field descriptions shipped with the results list the three numbers as north, east, up, while the PDF report labels them H, E, N. Confirm which order you are reading.
- PCO
- Phase-center offsets for this antenna, from the ANTEX file, one line per system and frequency. The third number is the vertical offset from the reference point to the phase center: 0.135 m on L1, 0.137 m on L2.
- IAR
- Percentage of carrier-phase observations whose ambiguities were fixed to integers. Partial resolution is the norm. NRCan's own tutorial shows a 15-minute session at 68.54 % and treats the result as sound.
- APR ELL
- Where the a priori position came from, and the ellipsoid used to convert between Cartesian and geodetic coordinates.
RINEXmeans the header, which is the next block.
The position block
The answer, twice: Cartesian on the first three rows, geodetic on the last three.
POS CRD  SYST        EPOCH          A_PRIORI         ESTIMATED       DIFF SIGMA(95%) CORRELATIONS
POS   X NAD83 23:256:65265       -26509.4860       -26509.6397    -0.1537     0.0071  1.0000
POS   Y NAD83 23:256:65265     -4987782.3281     -4987781.2374     1.0907     0.0237 -0.0287  1.0000
POS   Z NAD83 23:256:65265      3962072.6564      3962070.6041    -2.0523     0.0193  0.0816 -0.8312  1.0000
POS LAT NAD83 23:256:65265    38 38 57.28415    38 38 57.25425    -0.9221     0.0087  1.0000
POS LON NAD83 23:256:65265   -90 18 16.26326   -90 18 16.26986    -0.1595     0.0071  0.0912  1.0000
POS HGT NAD83 23:256:65265          145.6343          143.5014    -2.1329     0.0293 -0.0281  0.0679  1.0000
A_PRIORI — the position in the RINEX header
The three X Y Z values under
A_PRIORI are not a survey. They are whatever
position was written into the RINEX header as the marker's approximate location —
typically an autonomous fix the receiver computes for itself in the field, though RINEX
does not record how a given value was obtained. That header line reads:
-26509.4860 -4987782.3281 3962072.6564 APPROX POSITION XYZ
Digit for digit the same three numbers, which is what
APR RINEX promised.
DIFF — how far the answer moved
DIFF is the estimate minus the a priori, in
meters, including on the latitude and longitude rows where the coordinates themselves
are printed as degrees, minutes and seconds. Here the solution moved
0.92 m south, 0.16 m west and
2.13 m down — 0.94 m horizontally, 2.33 m in three dimensions.
A move of a couple of meters is the service working, not a problem. How far it
moves depends on how good the receiver's autonomous fix was, and says nothing about
the quality of the solution; for that, read
SIGMA(95%).
SIGMA(95%) — the confidence level
This column is how sure NRCan is about its own answer, stated at 95 %. A 95 % value is about 1.96 times one standard deviation. The latitude sigma of 0.0087 m at 95 % is about 0.0044 m at 1σ. Many instrument datasheets and software outputs quote 1σ instead, so setting a CSRS-PPP number beside one of those makes the PPP solution look twice as bad as it is.
SYST and EPOCH — the frame line
SYST reads NAD83
on every row and EPOCH reads
23:256:65265: year 2023, day of year 256, second
65265 of the day, in GPS time — the RINEX header declares
GPS on its
TIME OF FIRST OBS line, and the
.sum's own BEG
and END are in that same system. That is
18:07:45 GPST, the midpoint of the 17:08:00 to 19:07:30 observation — and
18:07:27 UTC, since GPS time ran 18 s ahead of UTC in 2023. NRCan's
PDF report writes the same thing as NAD83(CSRS) (2023.7).
So the coordinate is realized at the moment it was observed, not at the fixed epoch a control network or a basemap is published on.
CORRELATIONS
The lower triangle of the correlation matrix, read row by row: the Y row gives the X–Y correlation then its own 1.0000, the Z row gives X–Z and Y–Z, and so on. The −0.8312 between Y and Z follows from where the site is. At longitude −90° 18′ the local vertical lies almost entirely in the Y–Z plane and barely touches the X axis. On the geodetic rows the latitude–longitude correlation is 0.0912, which is what tilts the error ellipse below.
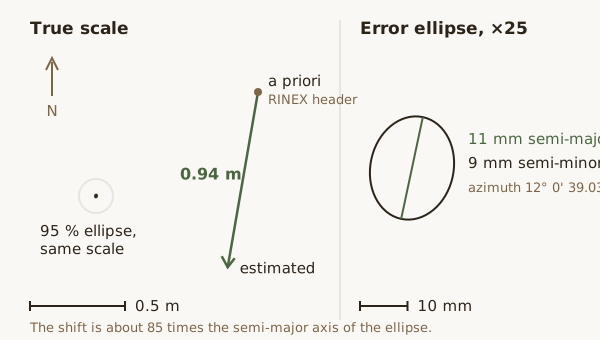
scripts/guides/csrs-ppp-report_figure.py.
Orthometric height and map projection
PRJ TYPE ZONE    EASTING     NORTHING   SCALE_POINT   SCALE_COMBINED HEMISPHERE
PRJ  UTM   15 734573.626  4281300.785    1.00027765       1.00025513          N
PRJ  MTM OUTSIDE_PROJ_LIMIT
OHT     SYST    MODEL             HEIGHT
OHT   CGVD28 HT2_1997 OUTSIDE_GRID_LIMIT
GHT OUTSIDE_GRID_LIMIT
The height in the position block is ellipsoidal: measured from the
GRS80 ellipsoid named on the ELL line, not from
anything a level would find. The OHT block is
where an orthometric height would appear, converted through a geoid model, and the
GHT line is the geoid height used to do it.
Both read OUTSIDE_GRID_LIMIT here, and the
reason is on the same line: the vertical datum is CGVD28
and the model is HT2_1997, both Canadian. This
point is in Missouri, outside the grid. PRJ MTM
fails the same way, since the Modified Transverse Mercator zones are Canadian too. The
UTM row is filled in, because UTM zone 15 covers the site.
This result shows only that a point outside Canada — outside the coverage of
CGVD28/HT2_1997,
specifically — gets an ellipsoidal height and no orthometric conversion. Converting
it to an orthometric height on a US vertical datum takes a US geoid model, applied
separately; nothing in this report does that for you. The difference between the two
is the geoid height, the number the GHT line
would have carried had the point fallen inside the model.
Residuals and rejected observations
Root-mean-square residuals per signal, in meters.
RES G C1C 0.643
RES G C2X 0.707
RES G L1C 0.005
RES G L2X 0.003
RES R C1C 0.734
RES R C2C 0.722
RES R L1C 0.005
RES R L2C 0.003
Code residuals run 0.64 to 0.73 m; carrier-phase residuals run 0.003 to 0.005 m. Two orders of magnitude separate them, and that gap is why precise point positioning works: the code observations give an unambiguous range that is noisy, and the phase observations give a precise one whose whole-cycle count has to be recovered.
Then a row per satellite, counting what happened to it.
FLG PRN    EPO    TRK    CLK    EPH    ELV    YAW    DCB    SLP    MIS    RES
FLG G08    159     51      0      0     20      0      0      8      0      0
FLG G10    240      0      0      0      0      0      0      0      0      0
...  26 more satellite rows
FLG GXX   1866    420      0      0    126      0      0     15      0      0
FLG RXX   1537    444      0      0    231      0      0     12      0      0
EPO counts the epochs where the satellite was
used. Most of the other columns count a reason it was not:
TRK missing observations,
CLK and EPH
missing clock or orbit corrections, ELV below the
elevation mask, YAW an eclipse maneuver,
DCB a missing bias correction,
MIS and RES
blunders and large residuals. SLP is different: it
counts cycle slips detected on that satellite, not epochs rejected because of one. G08
was used at 159, lost tracking at 51, sat below 7.5° for 20, and had 8 cycle slips
detected.
The GXX and RXX
rows total each constellation: 1866 GPS plus 1537 GLONASS satellite-epochs is
3403, and summing the
NSV column over all 240 rows of the
.pos file gives the same 3403 — 14.2 satellites
per epoch on average, ranging from 12 to 16.
The .pos file
One row per epoch, plus two summary rows. The header row names the columns.
DIR FRAME  STN   DAYofYEAR YEAR-MM-DD HR:MN:SS.SS NSV GDOP RMSC(m) RMSP(m)       DLAT(m)       DLON(m)       DHGT(m) SDLAT(95%) SDLON(95%) SDHGT(95%) LATDD LATMN    LATSS LONDD LONMN    LONSS     HGT(m)
FWD NAD83 rudo  256.713889 2023-09-13 17:08:00.00  13  1.4   0.520  0.0000       -2.1029        0.8311       -7.3583     5.7730     4.2483     9.8282    38    38 57.21596   -90    18 16.22889   138.2760
...  238 more FWD rows, one per epoch
FWD NAD83 rudo  256.796875 2023-09-13 19:07:30.00  15  1.3   0.443  0.0038       -0.9280       -0.1344       -2.1388     0.0046     0.0076     0.0118    38    38 57.25406   -90    18 16.26882   143.4955
FIX NAD83 rudo  256.796875 2023-09-13 19:07:30.00   0  0.0   0.000  0.0000       -0.9222       -0.1596       -2.1330     0.0024     0.0019     0.0080    38    38 57.25425   -90    18 16.26986   143.5013
SCA NAD83 rudo  256.796875 2023-09-13 19:07:30.00   0  0.0   0.000  0.0000       -0.9222       -0.1596       -2.1330     0.0087     0.0071     0.0293    38    38 57.25425   -90    18 16.26986   143.5013
DIR is the processing direction. The 240
FWD rows are the forward filter walking through
the session one epoch at a time. The last two rows are
the session's answer: FIX the final estimated
position, and SCA the same position with scaled
sigmas. The coordinates are identical and the sigmas are 3.6 to 3.7 times larger. The
SIGMA(95%) column in the summary file matches the
SCA row exactly, so the scaled figures are the
ones the report publishes; NRCan's tutorial says static sigmas are scaled to give more
realistic values, and does not print the factor.
DLAT DLON DHGT are differences from the same a
priori as the summary file, in meters north, east and up.
SDLAT SDLON SDHGT are the 95 % standard deviations
of that epoch's estimate, not of the session — at the first epoch they
are 5.8, 4.2 and 9.8 m, and at the last forward epoch 0.0046, 0.0076 and 0.0118 m.
The rest of the row is per-epoch quality and the position itself:
NSV satellites used,
GDOP geometric dilution of precision,
RMSC and RMSP
the code and phase residuals for that epoch, then latitude and longitude in degrees,
minutes and seconds and the ellipsoidal height.
Checks before you use the coordinate
-
Read
SYSTandEPOCH, and carry both with the coordinate. A position without its frame and epoch is a number, not a location. -
Divide
SIGMA(95%)by about 1.96 before comparing it with any figure quoted at 1σ — that holds when both quantities are comparable marginal Gaussian uncertainties, not, say, a 1σ range on a differently distributed quantity.
Field definitions quoted here come from
output_descriptions.txt, which NRCan included in this
result archive. The service and its documentation are at
webapp.geod.nrcan.gc.ca. Statements about ambiguity resolution and sigma scaling are from S. Banville,
CSRS-PPP Version 3: Tutorial, Canadian Geodetic Survey, Natural Resources
Canada, last updated 2020-08-25.
GNSS surveying at the lab
The lab runs GNSS control surveys, base-station occupations, and PPK workflows, and postprocesses the results.