Investigation
The Island Trace
· Historical GIS · Cartography · AI
The US National Archives catalogs this sheet as "Unidentified Map". It has no title, no scale bar, no north arrow and no legend — only numbered crosses, colored shapes, three place names and a table of coordinates. That turned out to be enough.
- Held by
- NARA, RG 407, "2nd Army Folder 19 – Overlays"
- Depicts
- The Island (Betuwe), between the Waal and the Nederrijn
- Made
- October 1944, 519 Field Survey Company RE, British Second Army
- Grid
- Nord de Guerre Zone, 1:25,000, GSGS 4427 sheets 6 NW and 6 SW
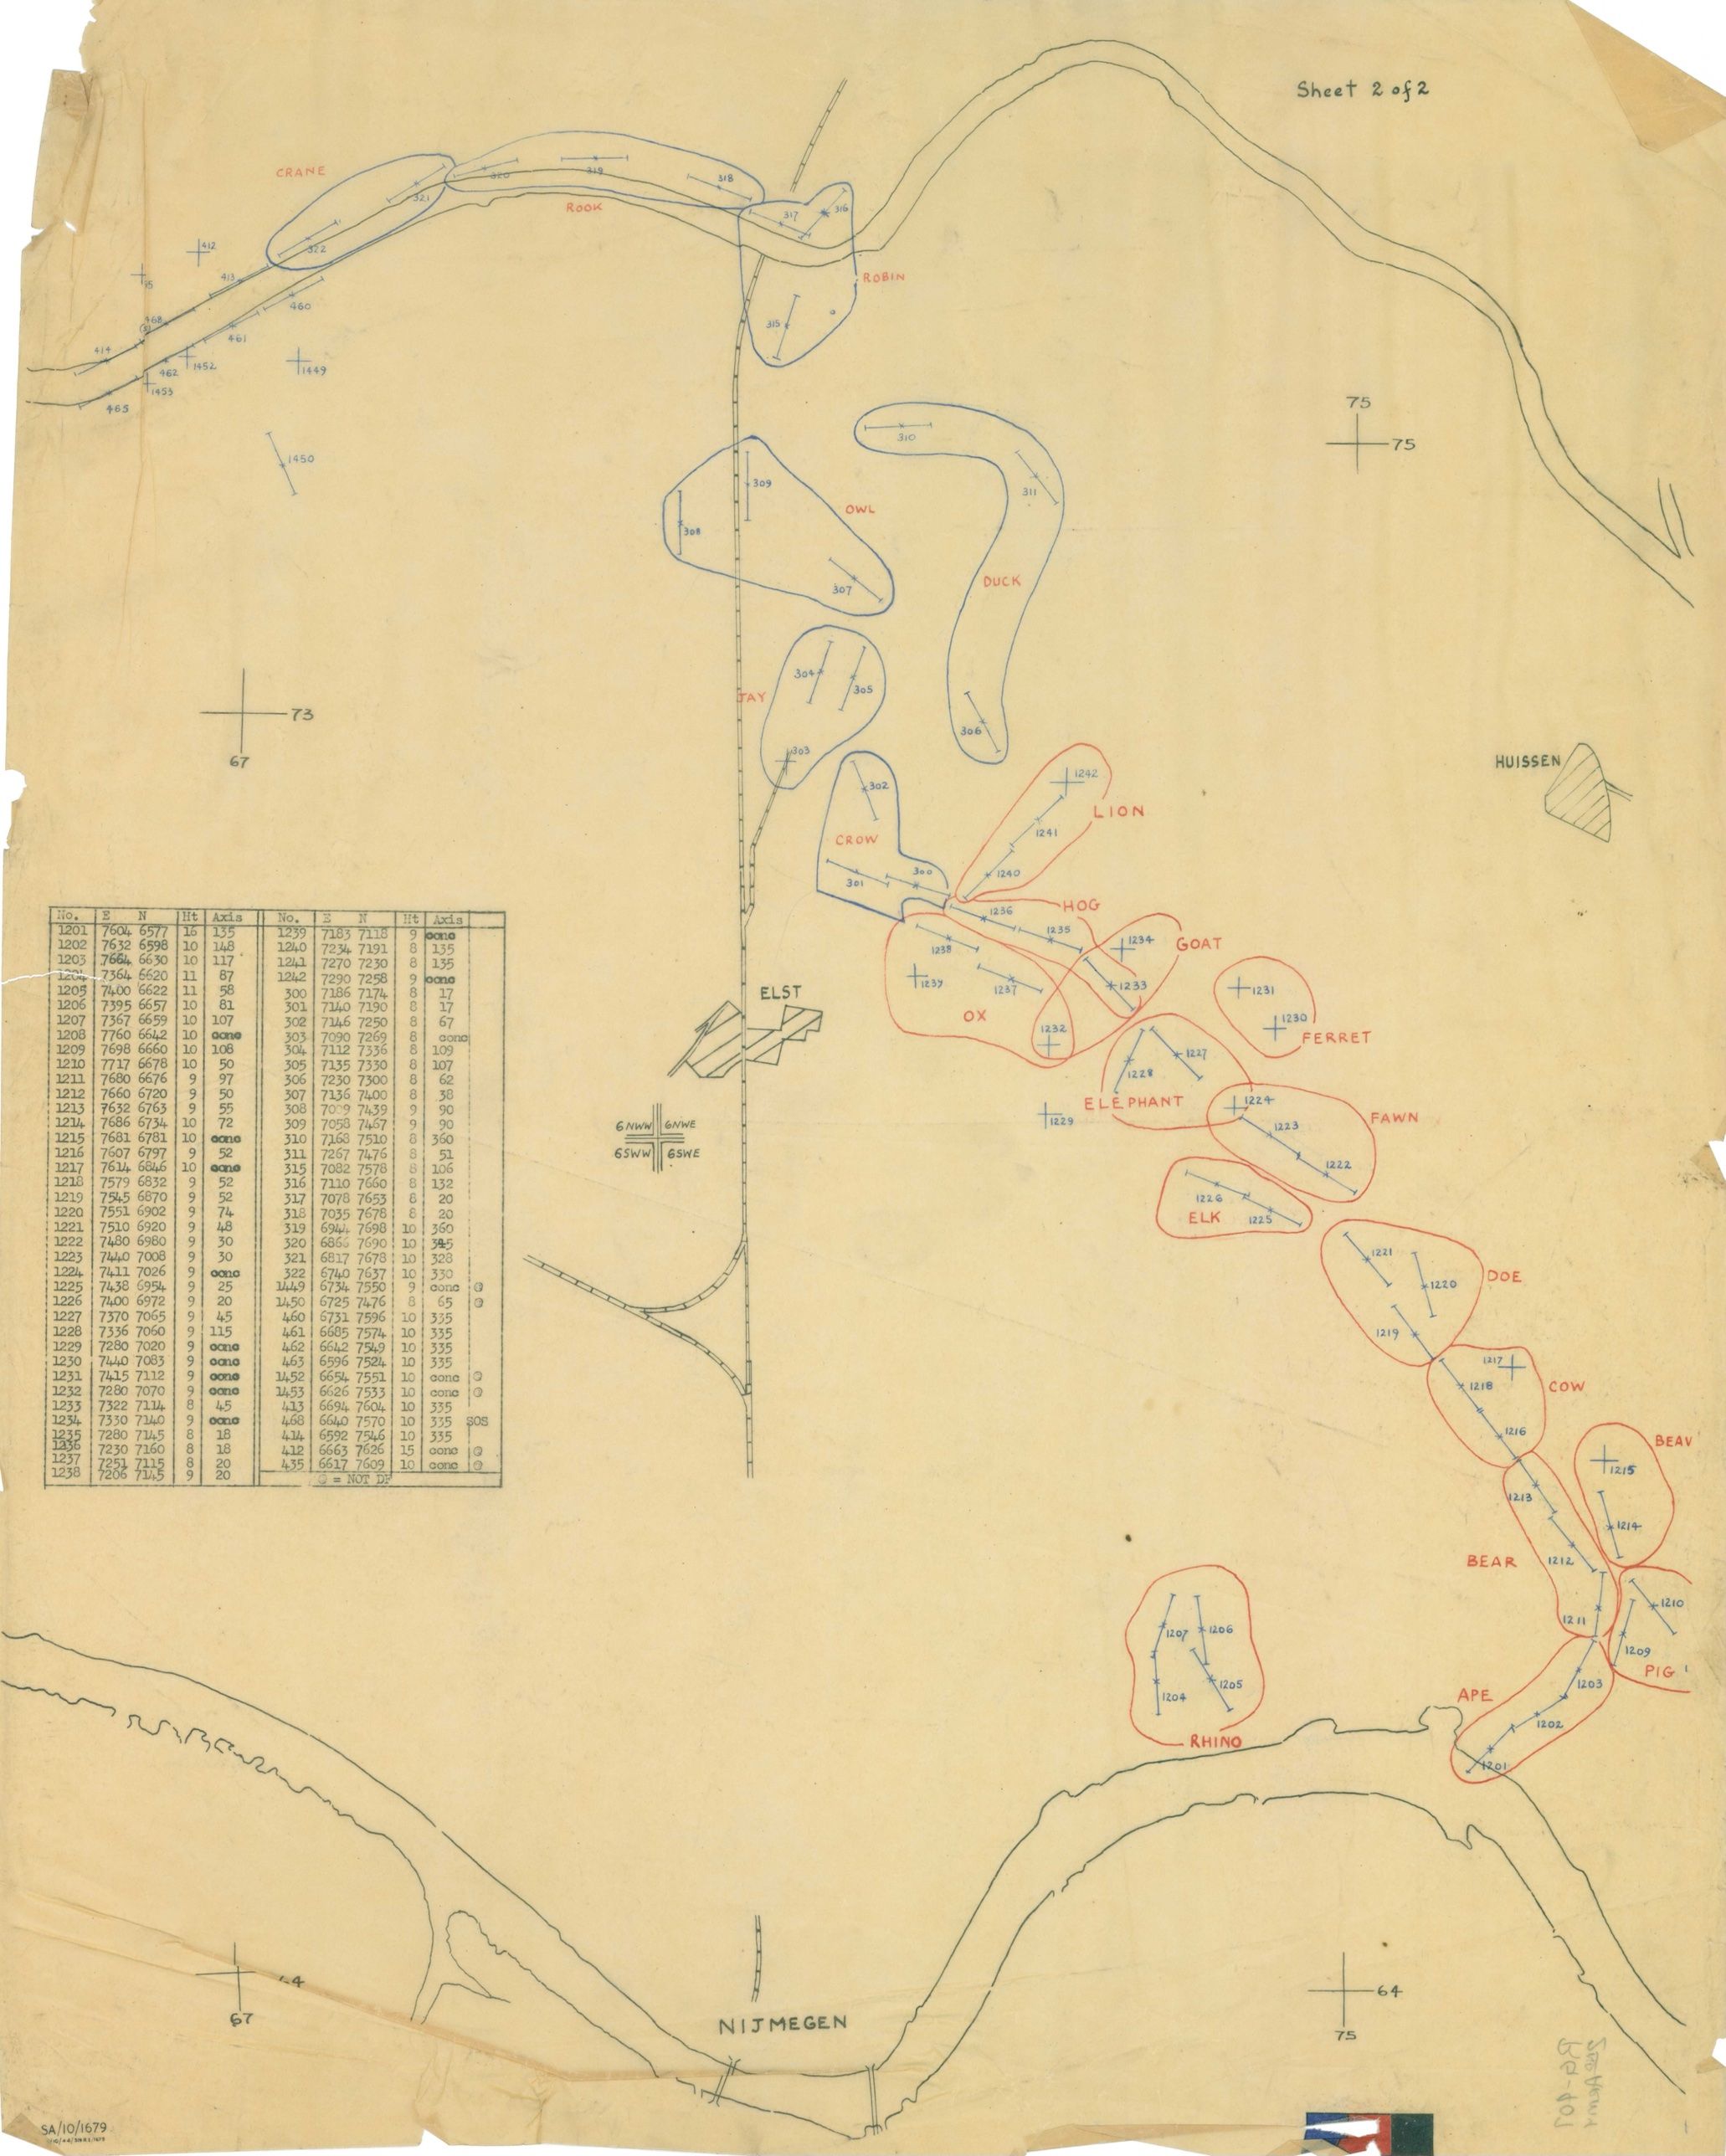
The sheet. National Archives Identifier 100384845; Wikimedia Commons file Unidentified_Map_-_NARA_-_100384845.jpg.

The puzzle
The sheet is tracing paper. On it are two rivers, a railway, a road junction, three place names, a typed table of seventy-four coordinates, and twenty-two shapes outlined in red and blue pencil, each labeled with an animal and each containing crosses with numbers beside them. Top right it says “Sheet 2 of 2”. Bottom left is a serial, SA/10/1679. There is no title, no scale bar, no north arrow, and no legend beyond a single line at the foot of the table.
An overlay is built to be read that way. It was drawn on tracing paper so it could be laid over a printed map, and everything the printed map supplied — towns, contours, roads, the grid itself — is absent here. What survives is only the part the printed map did not carry: where the shapes are, and what the numbers say.
We wanted to know whether the sheet on its own was enough to say what it was. It was. The sheet is a British artillery overlay of the Nijmegen bridgehead in the Netherlands, printed in October 1944. The rest of this note sets out how that is established, and how far each step can be checked.
Where it is
The place names are the first clue. NIJMEGEN sits beside the southern river, ELST at a road junction on the railway, HUISSEN off to the right. Those three towns lie within twelve kilometers of one another in Gelderland, in the Netherlands, on a strip of polder between two branches of the Rhine that the Allies called “the Island”: the Betuwe, with the Waal to the south and the Nederrijn to the north.
That makes the southern river the Waal, the northern one the Nederrijn, and the railway the Nijmegen–Arnhem line. Those three place names identify the general area, but they do not tell us much more than that.
Reading the grid
The table lists seventy-four entries under the headings No. · E · N · Ht · Axis.
E and N are grid references. A military grid lays a square kilometer mesh over the ground and numbers it, so a position can be given as a pair of numbers instead of a latitude and longitude. A British gunner in 1944 wrote them four figures at a time: 7604 6577 means 76.04 kilometers east and 65.77 kilometers north of the corner of a 100-kilometer square, which fixes a target to ten meters.
The grid here is the Nord de Guerre Zone, the Allied grid for the Low Countries. It is a Lambert projection with a formal modern definition, EPSG code 27500, so a present-day coordinate can be converted into a 1944 grid reference and back. The coordinate table provides a much stronger check.
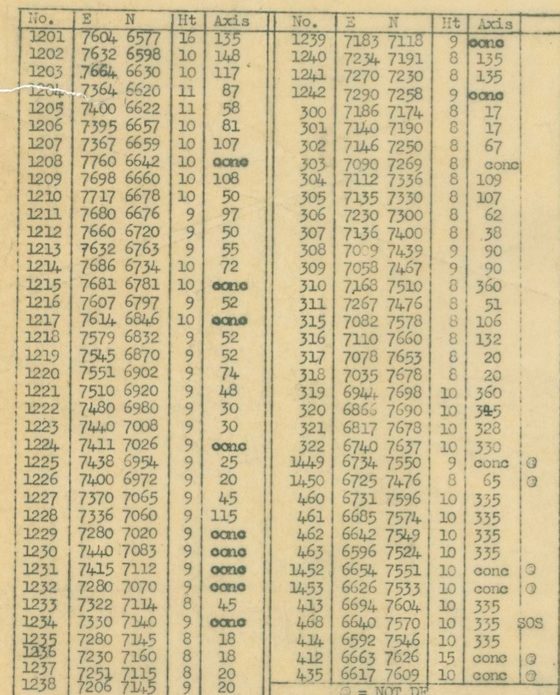
The table. Number, easting, northing, height in meters, and either a bearing in degrees or “conc”. The foot reads ”⊗ = NOT DF”.
A four-figure reference leaves out which 100-kilometer square it belongs to, so there are several candidates. Only one of them puts the three named towns in the right places relative to the seventy-four numbers. In that square, the modern coordinates of the landmarks come out as:
| Landmark | 1944 grid (E N) | On the sheet |
|---|---|---|
| Nijmegen, Waal road bridge | 7087 6329 | just north-east of the grid cross labeled 67 / 64 |
| Elst, church | 7077 7059 | the ELST block; targets 300 and 1238 a kilometer to its east |
| Huissen, center | 7619 7257 | the HUISSEN block; target 1242 (LION) three kilometers west |
| Driel | 6736 7446 | target 1450, 300 m north |
| Arnhem, road bridge | 7450 7684 | where the Nederrijn on the sheet turns north |
All five landmarks fall where the sheet places them.
The grid crosses drawn on the sheet, labeled 64, 67, 73 and 75, are the kilometer lines of that square. The four cramped labels at the double cross in the middle, 6NW W · 6NW E · 6SW W · 6SW E, name the printed map the overlay belongs on. GSGS was the British Army’s map-making branch, the Geographical Section of the General Staff, and its series 4427 was the 1:25,000 mapping of Holland. The labels are the east and west halves of sheets 6 NW (Arnhem) and 6 SW (Nijmegen), which meet at exactly that corner, grid 70 / 70.
The elevations provide another check. Most of the targets are in the Betuwe polder, about eight to ten meters above Dutch datum, and most of the elevations listed on the sheet are 8, 9 or 10 meters. Two targets have substantially higher elevations. Both lie across the river on the Westerbouwing bluff, where the ground rises to about fifty meters.
What the targets are
The line at the foot of the table settles what kind of map this is: ”⊗ = NOT DF”. DF is defensive fire. When a position expects to be attacked, its supporting guns register targets in advance along the routes an attack would use, so that an infantry company under assault can call for fire by number, in seconds. The numbered crosses are those registered targets.
A bar through a cross, with ticks at the ends, marks a linear target — a line of shells rather than a point — and the bearing of that line is the “Axis” column. Entries marked “conc” are concentrations, fire brought onto a single point. The few circled targets are on the list but are not defensive-fire tasks.
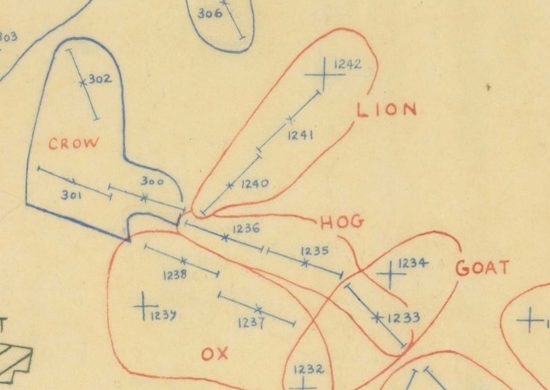
LION, HOG, GOAT, OX: the red block, east of Elst, facing the German line along the Wetering.
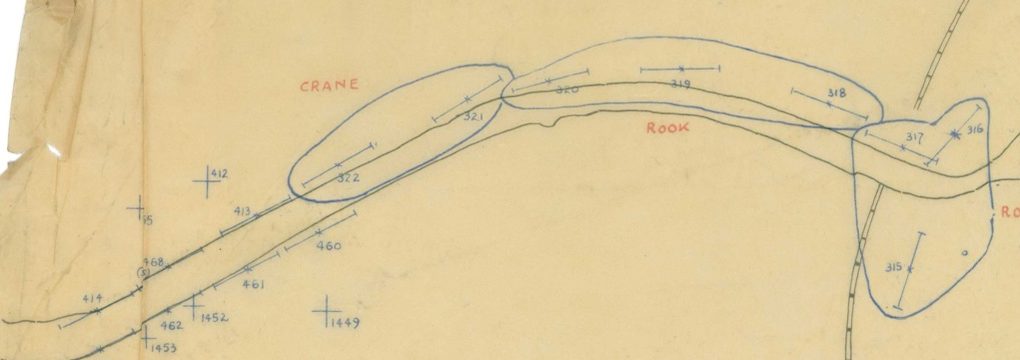
CRANE, ROOK, ROBIN: the blue block along the Nederrijn, with the 400-series cluster on the Driel–Heteren bank at left.
The animal names label the target areas a battery would be told to cover, and they are not chosen at random. Every red area is a mammal: RHINO, APE, PIG, BEAR, BEAVER, COW, DOE, ELK, FAWN, ELEPHANT, FERRET, OX, GOAT, HOG, LION. Every blue area is a bird: CROW, JAY, OWL, DUCK, ROBIN, ROOK, CRANE. Two naming schemes, two number series, two colors — two formations’ worth of defensive fire on a single sheet.
The shape of a front line
Plotting the seventy-four targets on a modern map reveals a clear pattern. They fall into three chains.
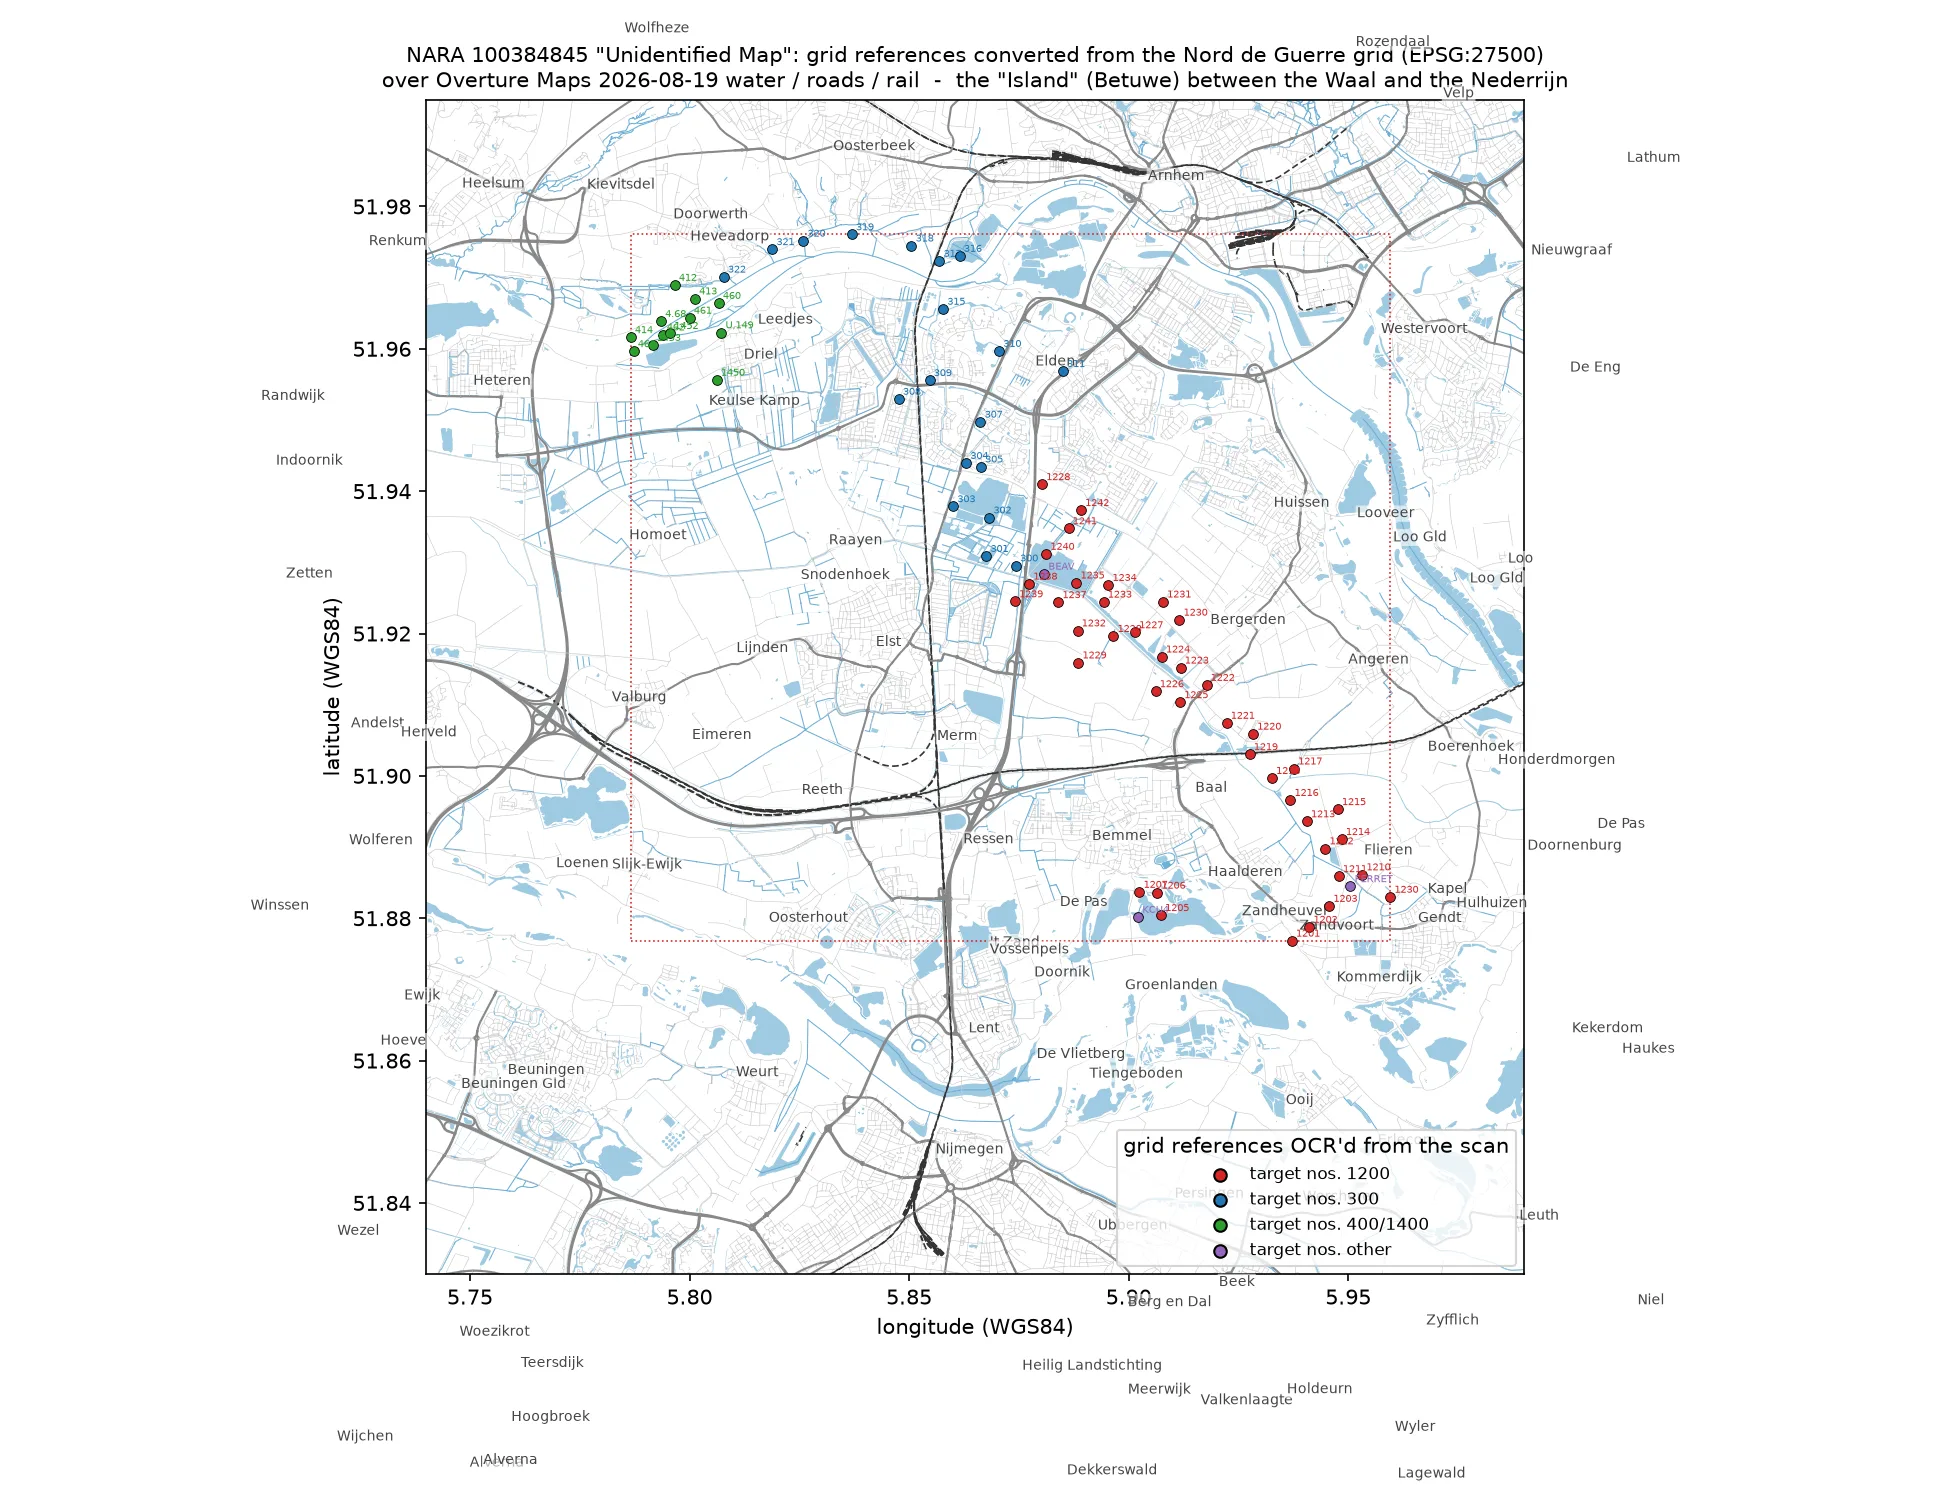
The table’s coordinates over today’s rivers, roads and railways. 1201–1242 run from the Waal dyke south of Haalderen north-west through Baal and Bergerden to the east side of Elst. 300–322 run from Elst north past Elden to the Nederrijn, then west along the river past the Driel ferry. The 400s sit on the south bank between Driel and Heteren.
After Operation Market Garden failed to hold Arnhem, the Allies were left holding the southern half of the Island: Nijmegen and its bridges, Elst, and the polder west to Opheusden. The Germans held the ground east of Bemmel, the approaches to the Arnhem bridge at Elden, and the whole north bank of the Nederrijn.
The red chain runs along the eastern edge of the Allied position and the blue chain along its northern edge by the river. Every target lies on the German side of that line. The overlay therefore appears to have been an Allied map of German positions and targets.
The two colors also match two sectors held by two formations. The eastern Island, from the Waal dyke at Haalderen up through Baal and Bergerden to Elst, was the 50th (Northumbrian) Division’s, with the US 508th Parachute Infantry attached from 6 October — the red block. The northern edge, from Elst past Elden and west along the river to Driel and Heteren, passed from the 43rd (Wessex) Division to the US 101st Airborne Division on 3–5 October, fighting under British corps command with British guns in support — the blue block.
Who made it, and when
The sheet is filed at the National Archives in College Park in a folder of the Adjutant General’s Office’s World War II records labeled “2nd Army Folder 19 – Overlays”. The US Second Army spent the war training troops in Tennessee, so the label is misleading. The folder’s other contents are Royal Artillery fire plans for the 3rd British and 51st Highland Divisions, a 12 Corps reference-point trace, and route-intelligence overlays for the Rhine, Weser, Elbe and Kiel Canal. This is the British Second Army, and the folder is a bundle of its artillery traces that ended up in American hands.
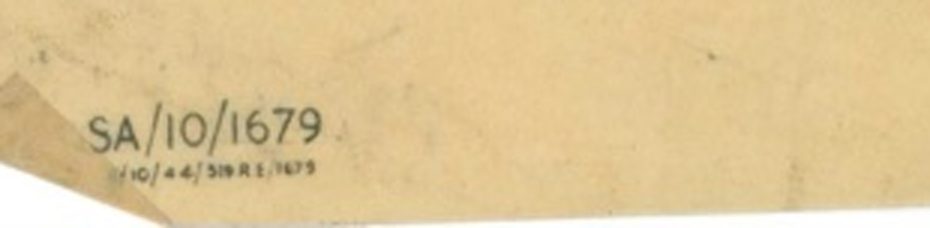
The imprint at bottom left. Beneath the serial, in smaller type: [?]/10/44/519 RE/1679.
The serial says the same thing in the sheet’s own hand. SA/10/1679 is Second Army’s number for the trace. The line beneath it is the printer’s: reproduced in October 1944 by 519 Field Survey Company, Royal Engineers, one of the two survey companies that landed with Second Army in June and handled its artillery survey and map printing through to Germany. Print number 1679.
October 1944 is the only month it could be. The Island became a British responsibility on 28 September, when the 101st Airborne came under British XII Corps there. On 9 November the whole Nijmegen salient passed to First Canadian Army. On 2 December the Germans blew the Nederrijn dyke at Elden and flooded the eastern Island, putting every red target under water. A Second Army trace of these two sectors, printed in October, sits inside the six weeks in which the ground it shows was the front.
Georeferencing
The evidence so far comes from the information printed on the sheet. We can check the reconstruction independently by georeferencing the overlay and seeing how well its grid aligns with the modern landscape.
The tracing-paper overlay does not contain a coastline or other base-map detail that can be matched directly to a modern map. It does contain five labeled grid crosses, originally used to align the overlay with the printed map beneath it, and those crosses provide control points for georeferencing the scan.
After transforming the wartime grid coordinates to modern coordinates, the control points agree with their expected locations to about seventeen meters, or roughly three pixels in the scanned image — about the width of the pencil lines. At this scale, that agreement strongly supports the identification of both the location and the grid system.
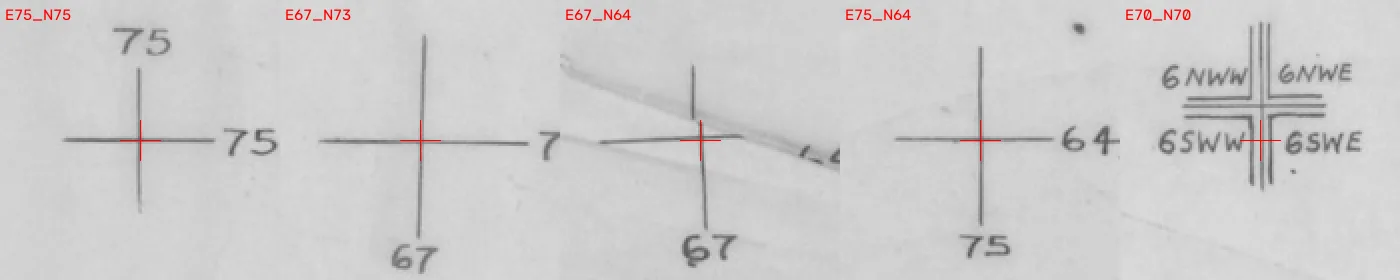
The five crosses. Eight grid kilometers span the sheet at four centimeters per kilometer: the overlay was drawn at the base sheet’s own 1:25,000.
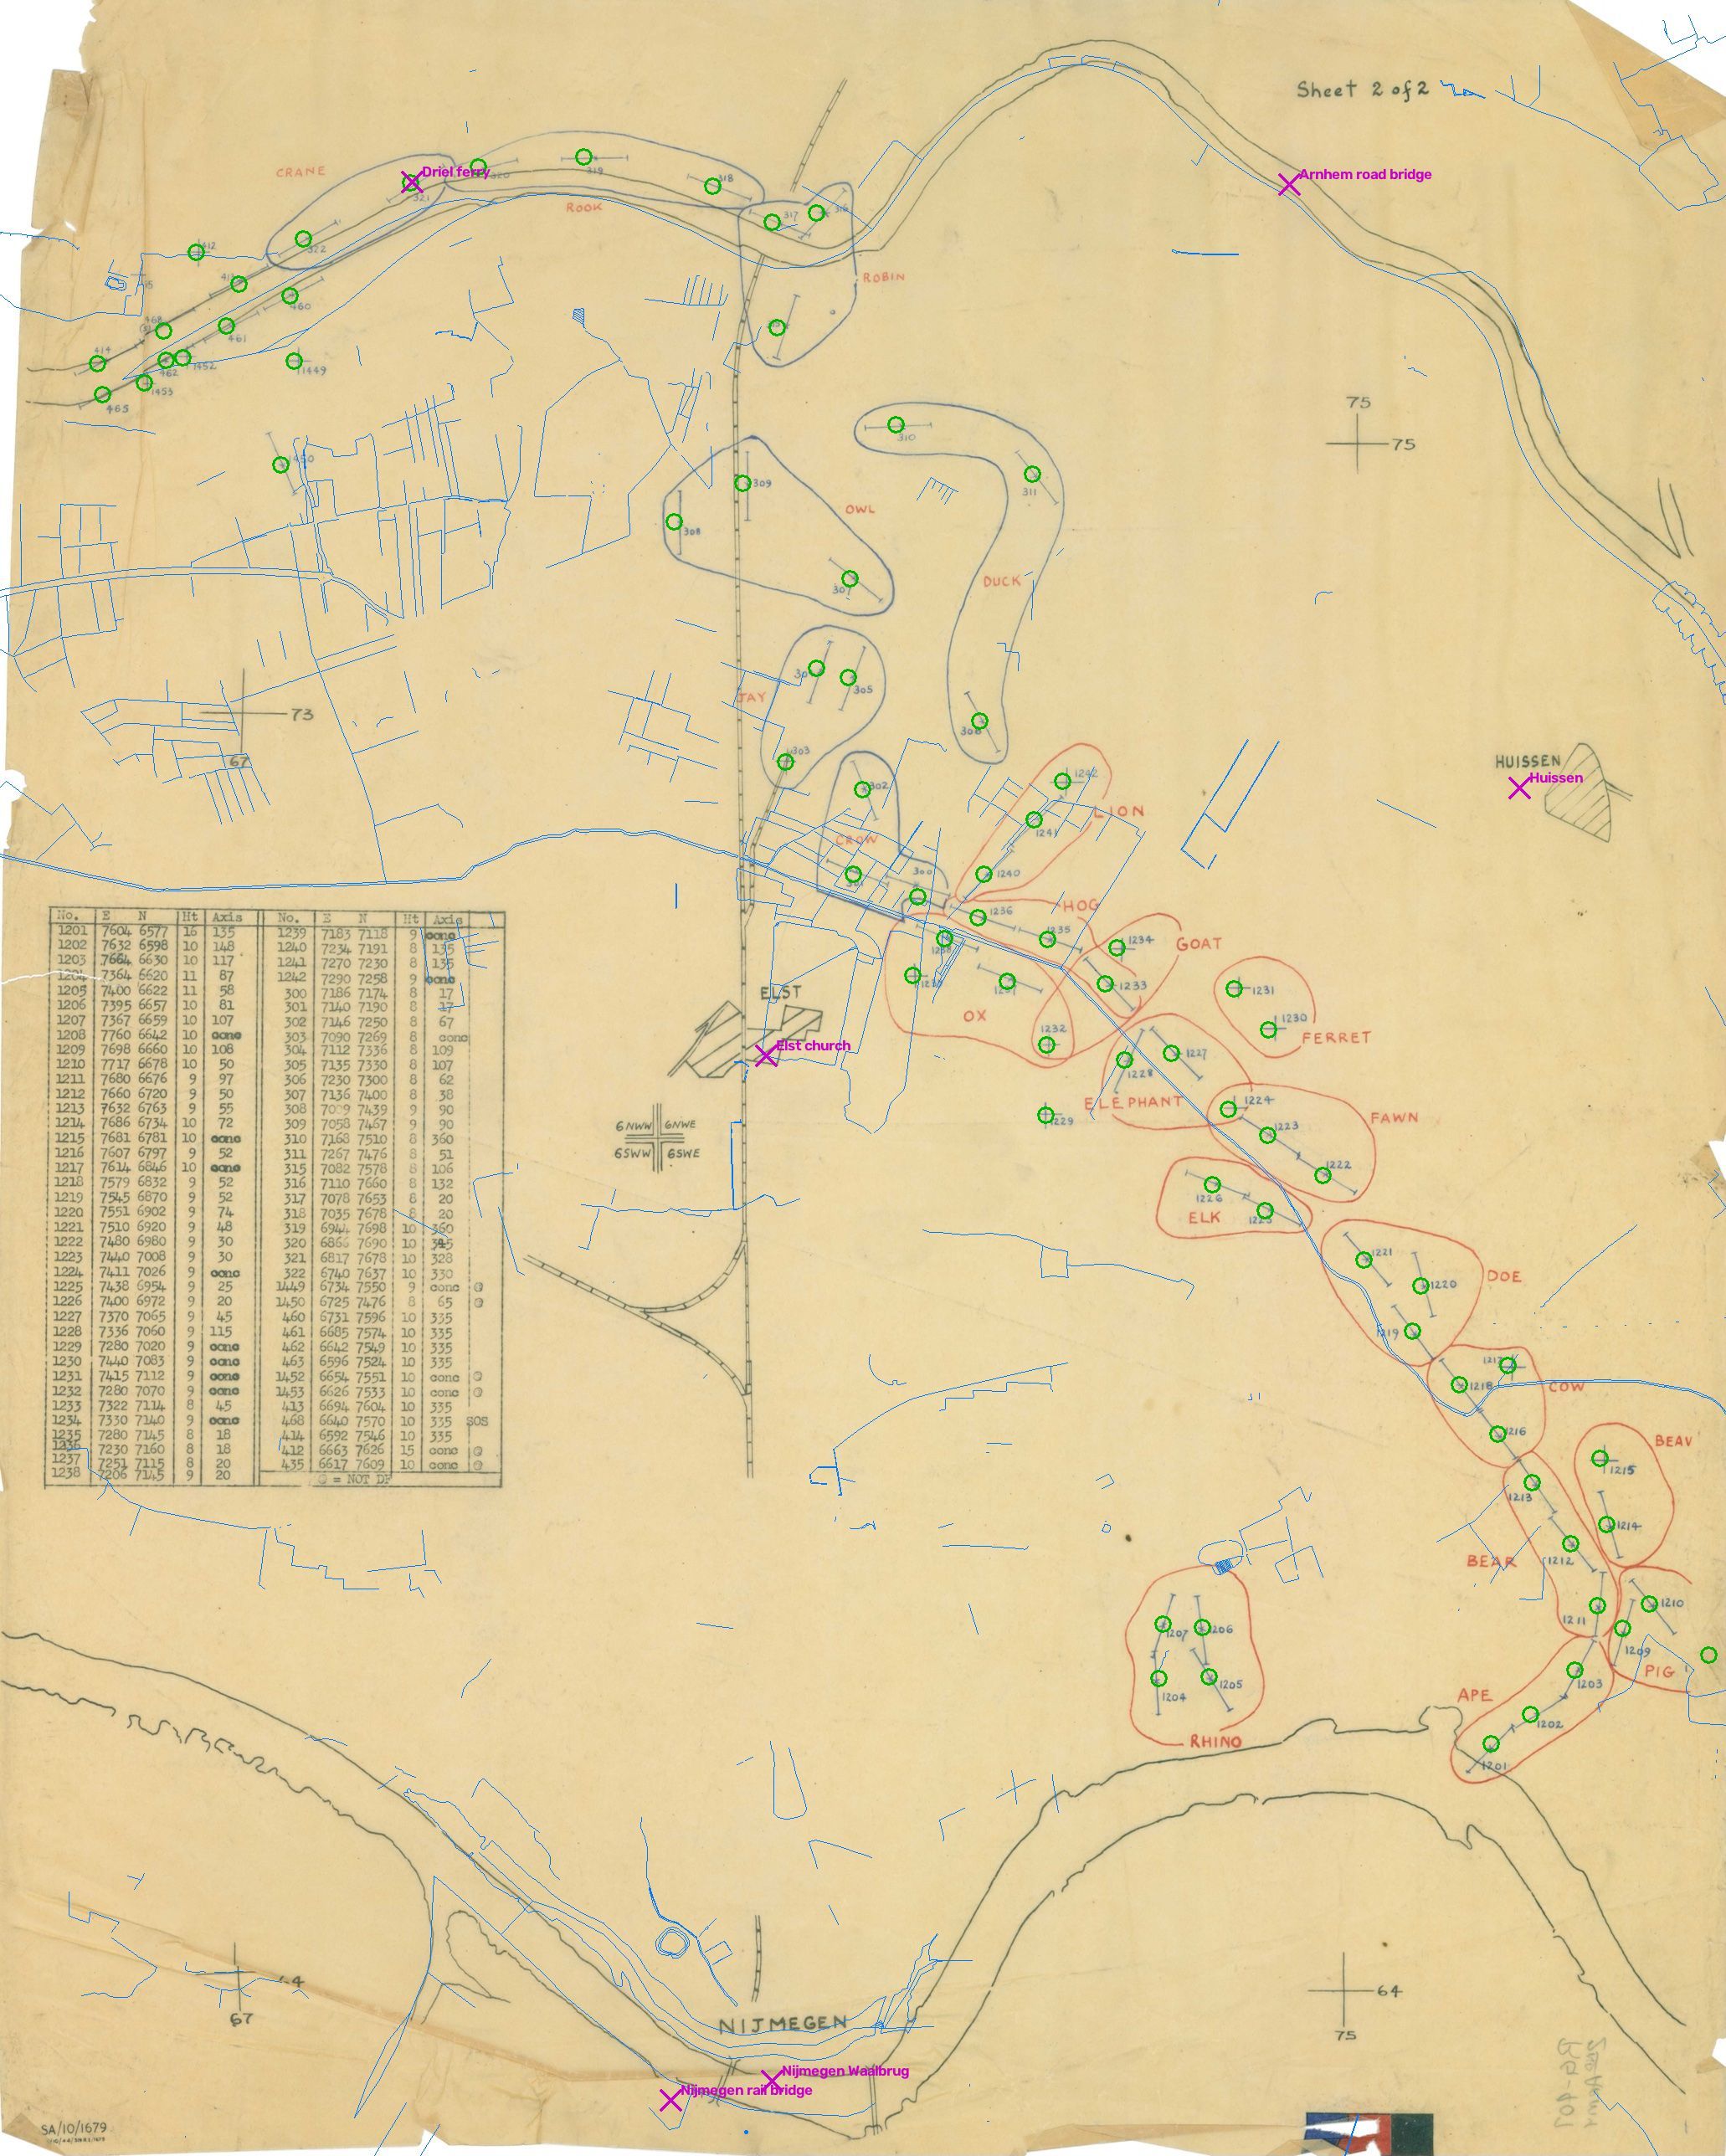
Drag the slider below. The right side shows what the fitted sheet claims: every one of the seventy-four table coordinates projected back onto the paper as a green circle, today’s rivers in thin blue, and the present positions of the Elst church, Huissen, the two Nijmegen bridges, the Arnhem bridge and the Driel ferry in magenta.
 the sheet the sheet, georeferenced
Every circle lands on its cross. The Elst marker falls on the hatched ELST block, the bridges on the two traced crossings of the Waal, the Driel ferry on the river between CRANE and ROOK. The sheet’s table and the sheet’s drawing agree with each other and with the ground.
How we did this
We used Fable 5.1, an agentic research model, for the investigation. We gave it the National Archives image and asked four things: what ground the sheet depicts, what it was for and when it was made, which printed map series it derives from, and whether it could be georeferenced — with reproducible evidence for each answer.
The investigation took about forty minutes. Fable searched archival and historical sources, retrieved the National Archives catalog record, worked out the grid, reconstructed the coordinates, and tested the result against modern geographic data.
What the sheet cannot tell us
It cannot tell us which day in October it was printed, or which regiments’ guns were laid on RHINO and CRANE; that is in the divisional artillery war diaries (WO 171) at Kew. It cannot tell us what was on Sheet 1 of 2, which would carry the title block; that sheet is not among the folder’s scanned items. And the first character of the printer’s line is not legible on the copy used here, though it should be on the National Archives’ full-resolution scan.
Everything else on this page can be checked. The catalog record, the seventy-four coordinates in modern latitude and longitude, the georeferenced GeoTIFF, the figures and the code that produces them are at github.com/fossettlab/island-trace.
Sources
- The sheet: NARA, National Archives Identifier 100384845, Record Group 407, series World War II Records; on Wikimedia Commons as File:Unidentified Map - NARA - 100384845.jpg.
- Grid: EPSG:27500, “ATF (Paris) / Nord de Guerre”. Base map: GSGS 4427 Holland 1:25,000, sheets 6 NW (Arnhem) and 6 SW (Nijmegen).
- Modern geography: Overture Maps release 2026-08-19; Copernicus DEM GLO-30.
- The Island in October 1944: Battle of the Nijmegen salient; 50th (Northumbrian), 43rd (Wessex) and 101st Airborne Divisions; 508th RCT at Bemmel (TracesOfWar); 519 and 521 Field Survey Companies RE.